Visualize CSV Data
A table can hide differences between numeric values. Visualize CSV columns as bar charts first, so you can spot scale, gaps, and unusual values before you use the data in a report or another format.
How CSV visualization works
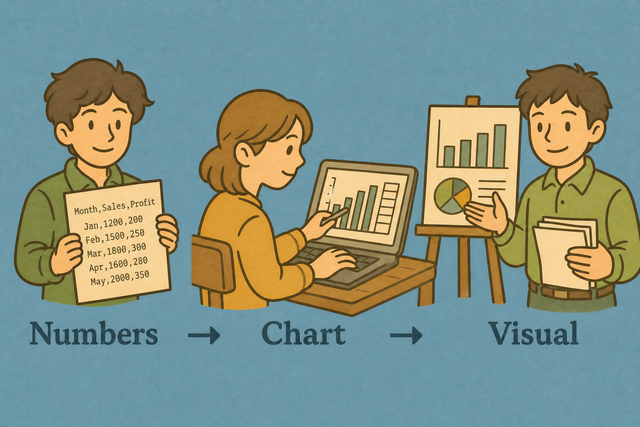
1. Add CSV data
2. Review the charts
3. Copy or download the result
Supported Formats
Add CSV data
You can paste CSV data, upload a file, or view an example
Parsing status
No CSV data yet
You can paste CSV data, upload a file, or view an example
CSV column charts
Compare numeric CSV columns with simple bar charts.
How to visualize CSV data
A numeric CSV table can make comparison difficult when rows contain many fields. For example, an Age column with values 36 and 29 is easier to compare as bars than as text in a grid. Visualize CSV reads the table in your browser and builds a quick chart from numeric columns, so you can review the data in context.
- You can add your data , Paste CSV text or upload a file. The chart is built in this browser, which keeps the review close to the data source.
- You can set the parsing options , Choose the separator and header setting that match the source file. This matters because a wrong separator can place every value in one column, while a wrong header setting can treat a column name as data.
- You can use the chart summary , Review the bars, then copy or download the summary when you need a record of the comparison. Related tools can help you inspect or process the original CSV further.
CSV data and chart input
What is CSV?
CSV is a plain text table with one row per line and fields separated by commas, semicolons, tabs, or pipes. For example, Name,Age,City places three fields in each row. This simple structure lets the visualizer parse rows and compare columns without formulas or styling.
Sample CSV input and chart summary
Example CSV input
Name,Age,City
Ada,36,London
Lin,29,Taipei
Example chart summary
Name,Age,City
Ada,36,London
Lin,29,Taipei
Common CSV chart problems
Will leading zeros affect the chart?
A value such as "00123" may represent an identifier rather than the number 123. Quoted values keep their zeros during parsing, but a spreadsheet may change them after opening the file. Keep identifier columns as text when the zeros carry meaning, because numeric conversion can remove information.
Why is every value in one column?
The file is probably semicolon- or tab-separated. Change Value separator to match, or use Change CSV Delimiter.
What about UTF 8 and Windows 1252?
Accented text can look incorrect when the file encoding does not match the parser. UTF 8 is a practical choice for mixed language data, because it represents a wide range of characters consistently across systems.
CSV visualization FAQ
Does Visualize CSV upload my file?
No. The page reads your CSV in the browser and draws bars from numeric columns. The file is not uploaded by this tool, so the chart review stays on your device.
Which columns get charts?
Columns with values that parse as numbers get charts. Text columns such as names and cities do not create bars because their values do not have a numeric scale.
Is this a full analytics suite?
No. This is a quick visual check of numeric column values, not a full analytics dashboard. It helps you compare scale and spot differences before deeper analysis.
Can I download a PNG of the chart?
No PNG export is available. You can use the chart preview for a visual reference or copy the numeric chart summary.
What if my CSV has no numbers?
The page shows that there is nothing to visualize. A CSV with text only has no numeric scale for bars, so a file with numeric columns is needed for a chart.
Can I visualize CSV data without installing software?
Yes. Numeric CSV columns render as bars in this browser tab. The page does not require a separate installation.